 Fraunhofer Institute for Solar Energy Systems ISE
Public Net Electricity Generation in Germany 2020: Share from Renewables Exceeds 50 percent
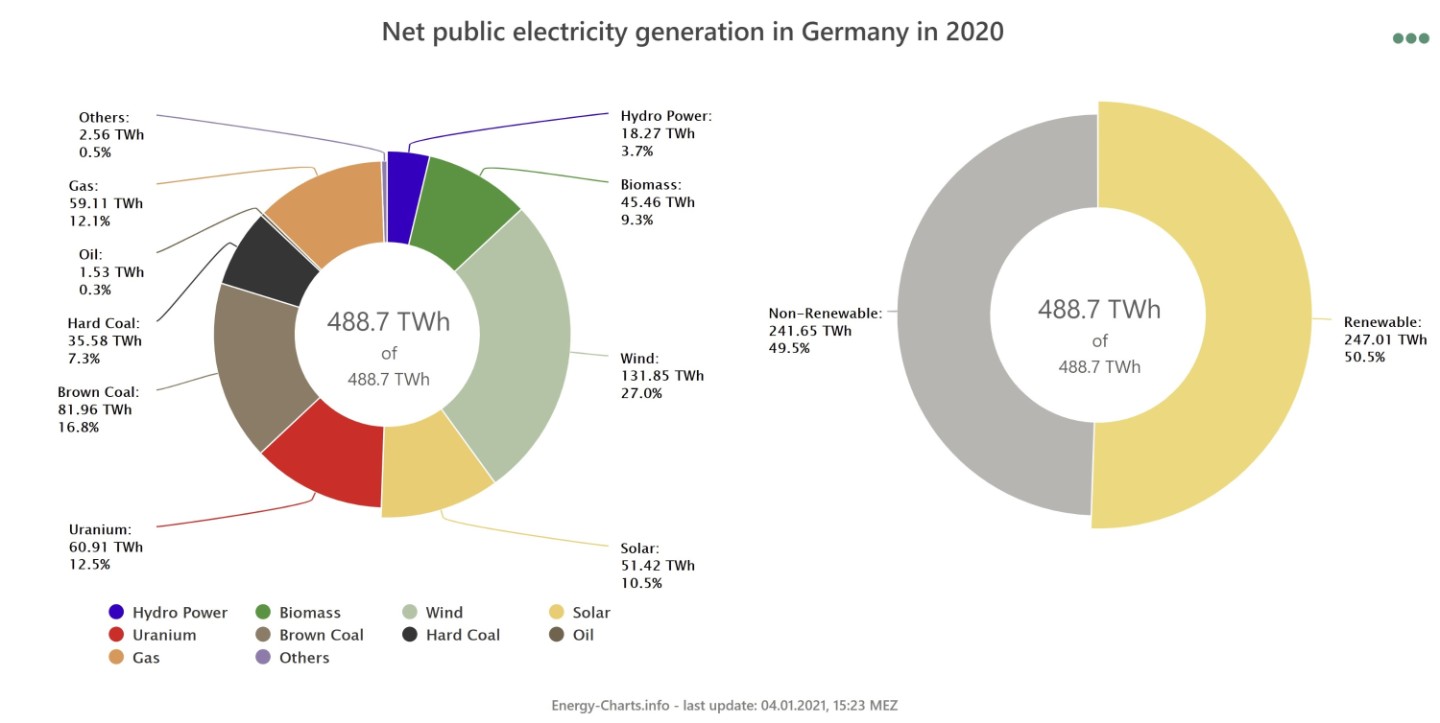
Researchers at the Fraunhofer Institute for Solar Energy Systems ISE have presented the latest figures on the annual electricity generation in Germany. The share of renewables in the net electricity generation (the amount coming from the socket) has exceeded 50 percent for the first time, rising from 46 percent in 2019. Electricity production by wind was again the most important source, with a share of 27 percent. Together, the generation from wind and photovoltaics (183 TWh) surpassed fossil fuels (178 TWh) for the first time.
In 2020, German photovoltaic (PV) plants fed about 50.7 TWh into the public electricity grid, an increase of 9.3 percent compared to 2019. New photovoltaic installations of 4.4 gigawatts increased the installed capacity to ca. 53.6 gigawatts (as of November). On June 1st, 2020 at 1 p.m., solar power production peaked at 37.25 gigawatts, corresponding to 56 percent of the total electricity production at this point in time. From March to September German photovoltaic plants generated more electricity per month than hard coal power plants.
Electricity from wind amounted to about 132 TWh in 2020, an increase of 4.6 percent. As a result, wind was again the main electricity source in Germany, followed by brown coal, nuclear power, gas and photovoltaics. In ten months of the past year, the electricity generation from wind surpassed brown coal and in twelve months nuclear. Wind power production peaked at ca. 46.9 GW on February 22 at 8:30 p.m., with a share of 67.4 percent. In 2020, onshore wind produced 105 TWh and offshore wind increased its output to 27 TWh, up from 24.5 TWh in 2019. On the other hand, the number of new onshore wind installations dropped again: By the end of October 2020, the installed power of onshore wind was 54.64 GW (plus 1.5 GW) and of offshore 7.74 GW (plus 0.14 GW), respectively.
Together wind and solar power plants generated a total of ca. 183 TWh electricity in 2020. For the first time, they were ahead of the total of all fossil sources (coal, oil, gas), which produced 178 TWh (up from 207 TWh in 2019).
Hydropower experienced a slight dip compared to 2019, contributing 18.3 TWh to electricity generation (2019: 20.6 TWh). Biomass, at 45.5 TWh, was slightly up on the previous year (43.86 TWh).
In 2020 the total electricity production from all renewable sources was about 246 TWh, an increase of 4 percent compared to 2019, generating more than 50 percent of net public electricity generation for the first time. In addition to net public electricity generation, this total net electricity generation includes self-generation by industrial and commercial entities, primarily using gas. According to BDEW calculations, the share of renewables in total gross electricity generation, including power plants operated by "establishments in the manufacturing sector and in mining and quarrying," is around 44.6 percent.
The high share of renewable energies is due on the one hand to favorable wind conditions and a high number of sunshine hours, and on the other hand to a decline in industrial electricity demand as a result of the Corona epidemic. To meet the EU's tightened climate protection targets (reduction of energy-related CO2 emissions by 65 percent by 2030 and by 100 percent by 2050) and the phase-out of coal and nuclear power, an accelerated expansion of wind and photovoltaic capacity is necessary: According to a recent study by Fraunhofer ISE, achieving the 2030 interim target will require an average annual addition of photovoltaics of 10.5-14.8 GW. For wind energy, an annual addition of 7.4-8.4 GW onshore and 1.4-1.7 GW offshore is required.
Further Decline in Electricity Generation by Coal and Nuclear Power Plants, gas-fired power generation increases
At 60.9 TWh, net electricity generation from nuclear power was around 14 percent down on the previous year's level (71 TWh). The decline is due to the shutdown of the Philippsburg 2 nuclear power plant.
Lignite saw another sharp drop, with net electricity production here falling by 20 TWh, or 19.6 percent, to 82 TWh; its share of net electricity generation was thus 16.8 percent (2019: 19.7 percent). Several coupled factors are responsible for the sharp decline in lignite-based electricity generation: higher CO2 certificate prices, higher electricity generation from renewables, lower exchange electricity prices, lower gas prices, lower electricity consumption, and fewer electricity exports. Net electricity production from hard coal fell by 13.9 TWh, or 28 percent, to 35.6 TWh, and its share is now only 7.3 percent.
Electricity generation from gas continues to rise, increasing its net electricity production by 6 TWh or 11.7 percent to 59TWh. As it produces significantly lower CO₂ emissions than generation from lignite, it also requires fewer CO₂ certificates. In addition to power plants for public electricity supply, there are also gas-fired power plants in the mining and manufacturing sectors for their own electricity supply. These produced an additional approx. 25 to 30 TWh for industrial captive use, which is not included in this publication.
Load decreased by about 2 percent to 475 TWh in 2020. This includes power consumption and grid losses, but not pumped-storage power consumption and own consumption by conventional power plants.
The average volume-weighted day-ahead exchange electricity price was €29.52/MWh. This is 19 percent lower than in 2019, when it was €36.64/MWh. The trading volume in 2020 was 216 TWh. The average volume-weighted intraday hourly price was €32.53/MWh, 15.5 percent lower than in 2019, and trading volume was 46 TWh.
Export surplus declining
The export surplus (physical flows) decreased from 34 to 18 TWh in 2020. The main customer was Poland (11.2 TWh), ahead of Austria (8.4 TWh), the Czech Republic (6 TWh) and Switzerland (5 TWh). Germany imported 10.3 TWh of electricity from France. The physical electricity flows do not provide information on whether the electricity was actually consumed in the country or whether it was forwarded to neighboring countries.
The picture is different for scheduled commercial exchanges. Here, exports to Austria (18.4 TWh), the Czech Republic (3.8 TWh), Luxembourg (3.8 TWh), Poland (2.9 TWh) and France (1.6 TWh) can be seen. Imports are from Denmark (6.9 TWh), Sweden (2.1 TWh), Netherlands (1.6 TWh) and Switzerland (1.4 TWh). In electrical terms, Germany now has two new neighboring countries for electricity exchange, Belgium (ALEGrO direct current line, since September 2020) and Norway (NordLink direct current line, since October 2020). In terms of foreign trade in electricity, 34.9 TWh were imported up to and including October at a value of 1.5 billion euros. Exports were 45.2 TWh at a value of 2.05 billion euros. The net result for the first ten months was an export surplus of 10.3 TWh and revenues worth 549 million euros. Imported electricity cost an average of 42.87 euros/MWh and exported electricity 45.27 euros/MWh.
Data Sources and Information
This first version from January 4, 2021, takes into account the electricity data of the European Electricity Exchange (EEX) in Leipzig through December 31, 2020. The hourly energy values were corrected using the available monthly data on electricity generation from the Federal Statistical Office (Destatis) up to and including September 2020 and the monthly data for electricity import and export up to and including October 2020. For the rest of the months, the correction factors were estimated based on data from the past years. The extrapolated values are subject to larger tolerances.
This publication is based on data on German net power generation for public power supply. The difference between gross electricity generation and a power plant's own consumption is the net electricity generation fed into the grid. The entire electricity industry calculates with net figures, e.g. for electricity trading, grid calculation, grid utilization, power plant deployment planning, etc. Even on the German power exchange EEX, only net power generation is traded, the transmission system operators calculate with net flows, and only net figures are measured for cross-border power flows. Net electricity generation represents the mix of electricity that actually comes out of the socket at home and is consumed in the household or used to charge electric vehicles publicly.
Hourly updated data can be found in the Energy Charts:
![Net_el_generation_2020.jpg [ JPG 0.42 MB ]](/content/dam/ise/en/images/News/Net_el_generation_2020.jpg)
![annual_Sport_prices_certificats.jpg [ JPG 0.35 MB ]](/content/dam/ise/en/images/News/annual_Sport_prices_certificats.jpg)
![annual_shares_ren_2002_2020.jpg [ JPG 0.35 MB ]](/content/dam/ise/en/images/News/annual_shares_ren_2002_2020.jpg)
![annual_net_electricity_generation.jpg [ JPG 0.42 MB ]](/content/dam/ise/en/images/News/annual_net_electricity_generation.jpg)
Last modified: