Press Release #15
German Net Electricity Generation in First Half of 2021: Decline in Renewables due to Weak Winds
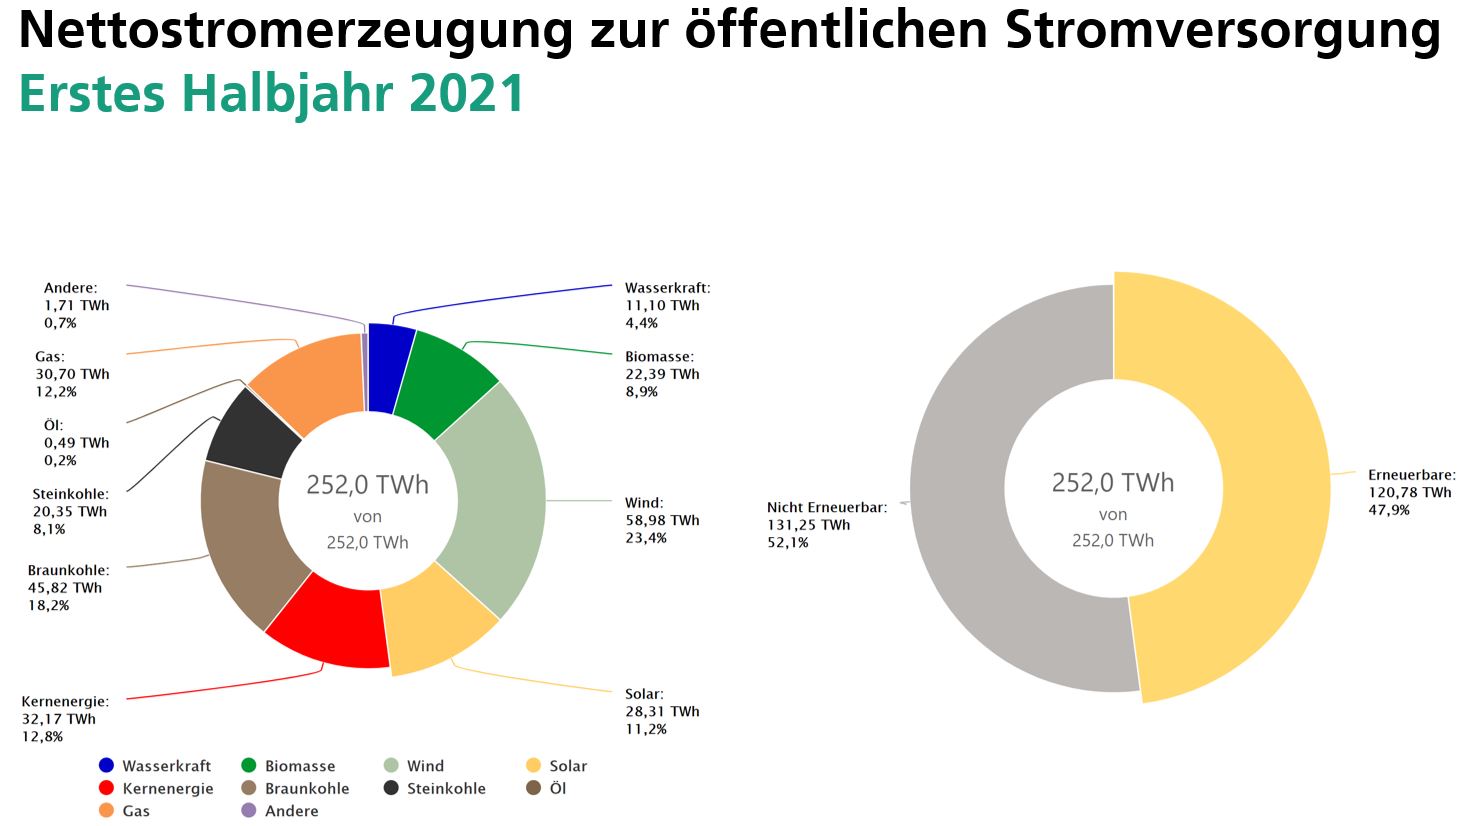
The Fraunhofer Institute for Solar Energy Systems ISE just presented the data on the net electricity generation for the public power supply for the first half of 2021 from the Energy Charts data platform. At 47.9 percent, the share of renewables in the electricity mix coming out of the socket was much lower than in the first half of 2020 (55.8 percent). In the first six months of 2021, solar and wind fed a total of 87.3 terawatt hours (TWh) into the public grid, compared with 102.9 TWh within the same time period in 2020. This was mostly due to the large drop in wind power, which declined by 20.5 percent compared to 2020. In contrast, the share of net electricity generation in the public power supply from brown coal (+37.6 percent), hard coal (+38.9 percent), gas (+18.6 percent), hydropower (+15.9) and nuclear power (+7.1 percent) all increased.

Electricity Generation and Demand Approach Pre-Corona Levels
After electricity generation and consumption declined in the first half of 2020 due to decreased industrial production during the COVID-19 pandemic, they reached their pre-corona levels again in 2021. In the first half year of 2021, electricity consumption amounted to 248.5 TWh (first half of 2019: 245.7 TWh) after it fell to 234.2 TWh in 2020 due to corona. The electricity production in 2021 also increased compared to the first half of 2020 from 242.7 TWh to 252.0 TWh. Production remained, however, below the 2019 level (264.5 TWh). Electricity exports rose slightly from 7.5 to 9.1 TWh, with the key export countries being Austria, France, Luxembourg and Switzerland.
Less Electricity Generation from Wind
In the first half of 2021, photovoltaic systems fed approx. 28.31 TWh into the public grid, a slight increase from the previous year (27.9 TWh), thus contributing a share of 11.2 percent to the public net electricity generation. Wind power’s share fell drastically by 20.5 percent (or 15.2 TWh) down to 58.98 TWh because of the unfavorable weather conditions. In spite of this, wind remained the most important renewable energy source. While above-average wind levels were evidenced in 2019 and 2020, wind in 2021 has been below average up to now.
Hydroelectric production in the first half of 2021 was approximately 11,10 TWh, an increase of 15.9 percent compared to the prior-year period (9.5 TWh.) Approximately 22.4 TWh were produced from biomass, a slight decrease of 5.3 percent compared to the previous year level.
In the first half of 2021, the sum of renewable electricity production from solar, wind, hydro and biomass fell sharply to a total of approx. 120.8 TWh compared to 136.1 TWh in 2020. Thus, the share of renewables in the net public electricity generation, i.e. the electricity mix that actually comes out of the socket, was approx. 47.9 percent for the first half of 2021 and thus much lower than for the same period in 2020 (55.8 percent).
Coal-Fired Electricity Significantly Higher Despite CO2 Price Increase
Net electricity generation from nuclear power amounted to approx. 32.2 TWh in the first half of 2021, increasing 7.1 percent compared to 2020 (ca. 30.1 TWh). However, nuclear power generation still remains below the level of 2019 (34.6 TWh). After its strong decline in the first half of 2020, coal-fired electricity generation experienced a revival.
In the first half of 2021, brown coal power plants produced about 45.8 TWh, a sharp increase of 37.6 percent compared to 2020 (33.6 TWh). In the same period, electricity generation from hard-coal power plants also increased, rising 38.9 percent to 20.4 TWh, as compared to 14.4 TWh in 2020.
In spite of this decrease, the electricity generation from coal-fired and nuclear power plants in 2021 remained below 2019 levels, so that the long-term downward trend remains unbroken. Also, the fuel switch from coal to natural gas, due to the higher prices for CO2 certificates, continues in 2021. Compared to 2020, the gas-fired power stations increased production by 18.6 percent to 30.7 TWh. Compared to 2019, this is a plus of 25 percent.
The average CO2 certificate price doubled from 21.91 Euro/t-CO₂, to 42.33 Euro/t-CO₂. The economic efficiency of coal-fired power plants that emit about one tonne CO₂ per generated megawatt hour of coal-fired electricity was possible only because the day-ahead price more than doubled, rising from 22.94 Euro/MWh to 53.42 Euro/MWh.
In addition to the power plants for the public electricity supply, there are also gas-fired power plants in the mining and manufacturing industries to supply their own electricity. These produced an additional 20 TWh for the company’s own industrial needs.
Data Sources and Information:
The numbers given take into account the monthly data available up to July 5, 2021 from the Federal Statistical Office (Destatis) on electricity generation and on the import and export of electricity up to and including April 2021. The data for May and June were extrapolated on the basis of corrected hourly values from the Leipzig Electricity Exchange EEX and the four transmission system operators (50 Hertz, Amprion, Tennet, TransnetBW). The extrapolated values are subject to greater tolerances. Hourly updated data can be found on the Fraunhofer ISE Energy Charts: https://www.energy-charts.de/index.htm
Downloads
Last modified: