Press Release #15
Online Energy Charts Make German Energy Transformation Transparent for All – Fraunhofer ISE launches online comprehensive energy database
The Fraunhofer Institute for Solar Energy Systems ISE now provides online electrical energy data for Germany promptly and free-of-charge. “By making the data available on this website, it is our intent to promote transparent and objective discussions relating to all factors regarding the energy transformation in Germany,” says Professor Eicke Weber. Interactive data charts, which can be individually tailored by the user, display the power produced in Germany from all conventional and renewable sources as well as import and export data. This comprehensive database is now available online: www.energy-charts.de.
“Our graphs of electricity production are very popular: for one, because we collect the data from several neutral sources and secondly because we continually update the time series data promptly,” reports Professor Bruno Burger, who heads the data collection efforts and the strategic development of this database at Fraunhofer ISE. Since 2011 Burger has made the data available on Fraunhofer ISE’s homepage. Additionally he often is called upon to answer questions on this topic from political and scientific spheres as well as from the media and players in the energy economy. The database has also found fame internationally. “The Japanese Ministry for the Environment had 200 pages from the energy charts translated into Japanese in order to display the data on their own homepage,” explains Prof. Burger.
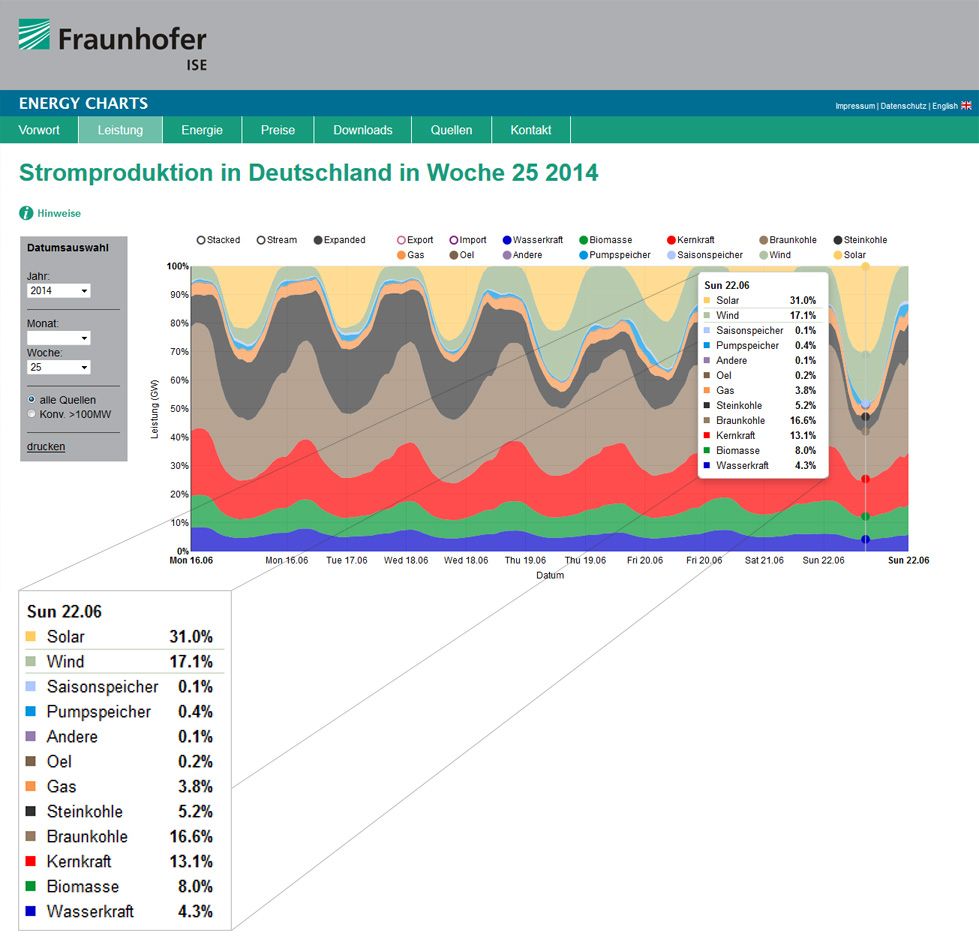
Visitors to the site www.energy-charts.de can customize the graphs themselves according to their needs: power, energy, and prices can be selected, different energy sources can be chosen and the parameters can be displayed as absolute values or as percentages. As an example, a graph of the electricity production in Germany during the twenty-fifth calendar week in 2014 is shown here. One sees that solar energy covers the entire peak load and that all renewable energies together provided 60.4 percent of the electricity production on Sunday afternoon. At present, the data are presented and updated on a weekly basis. In future, some of the data will be presented on a daily time scale.
Last modified:
