 Fraunhofer Institute for Solar Energy Systems ISE
Public Net Electricity Generation in Germany in 2021: Renewables Weaker Due to Weather
The Fraunhofer Institute for Solar Energy Systems ISE has presented the annual figures for the German electricity generation in 2021. Due to weather conditions, the share of renewables in the net electricity generation (the electricity mix coming from the socket) fell to 45.7 percent, compared to 50.0 percent in 2020. Wind power with a share of 23.1 percent was again the most important source of electricity, yet this value was around 12 percent less than 2020.
In 2021, German photovoltaic systems generated about 48.4 TWh electricity, about 44.6 TWh of which were fed into the public grid and 3.8 TWh were self-consumed. An additional 4.9 gigawatts increased the total installed PV capacity to about 58.6 gigawatts as of November. The monthly electricity generation of PV plants was higher than that of hard coal-fired power plants from March to August and higher than that of gas-fired power plants from April to October in 2021.
In 2021, electricity from wind power amounted to about 113.5 TWh, compared to 132 TWh in 2020. Lower wind speeds caused this decline in production. Again, wind power was the main source of electricity in Germany, followed by lignite, nuclear, gas, solar, hard coal, biomass, and hydropower. Electricity generation from wind power exceeded that from lignite in nine months of the year and that from hard coal and from gas in all twelve months. Onshore wind power production accounted for about 89.5 TWh and offshore production for about 24 TWh. The North Sea produced about 18.5 TWh, and the Baltic Sea produced 3.5 TWh. The addition of wind capacity, both onshore and offshore, was again very weak: At the end of November, the installed capacity of onshore wind was 56.1 GW (up only 1.7 GW from 2020). Offshore wind capacity was 7.77 GW (up by 0 GW).
Together, solar and wind produced about 162 TWh in 2021, down by ca. 15 TWh compared to 2020. After an above-average wind year in 2020, 2021 was below average for wind and also for solar.
Hydropower contributed 19.4 TWh to electricity generation, up from 18.2 TWh in 2020. With hardly any change in installed capacity, biomass generated slightly more electricity in 2021 (43 TWh) than in 2020.
In total, renewable energy sources produced about 225 TWh in 2021, about 6 percent below 2020’s value of 240 TWh. The share of renewables in the public net electricity generation fell to 45.7 percent, compared to 50 percent in 2020. In addition to public net power generation, this total net power generation includes self-generation by industrial and commercial enterprises, which mainly involves gas. According to the calculations of AG Energiebilanzen, the share of renewables in total gross electricity generation, including power plants operated by "establishments in the manufacturing sector, mining and quarrying," is around 41.8 percent.
Coal-fired power generation and nuclear power up again, gas-fired power generation down
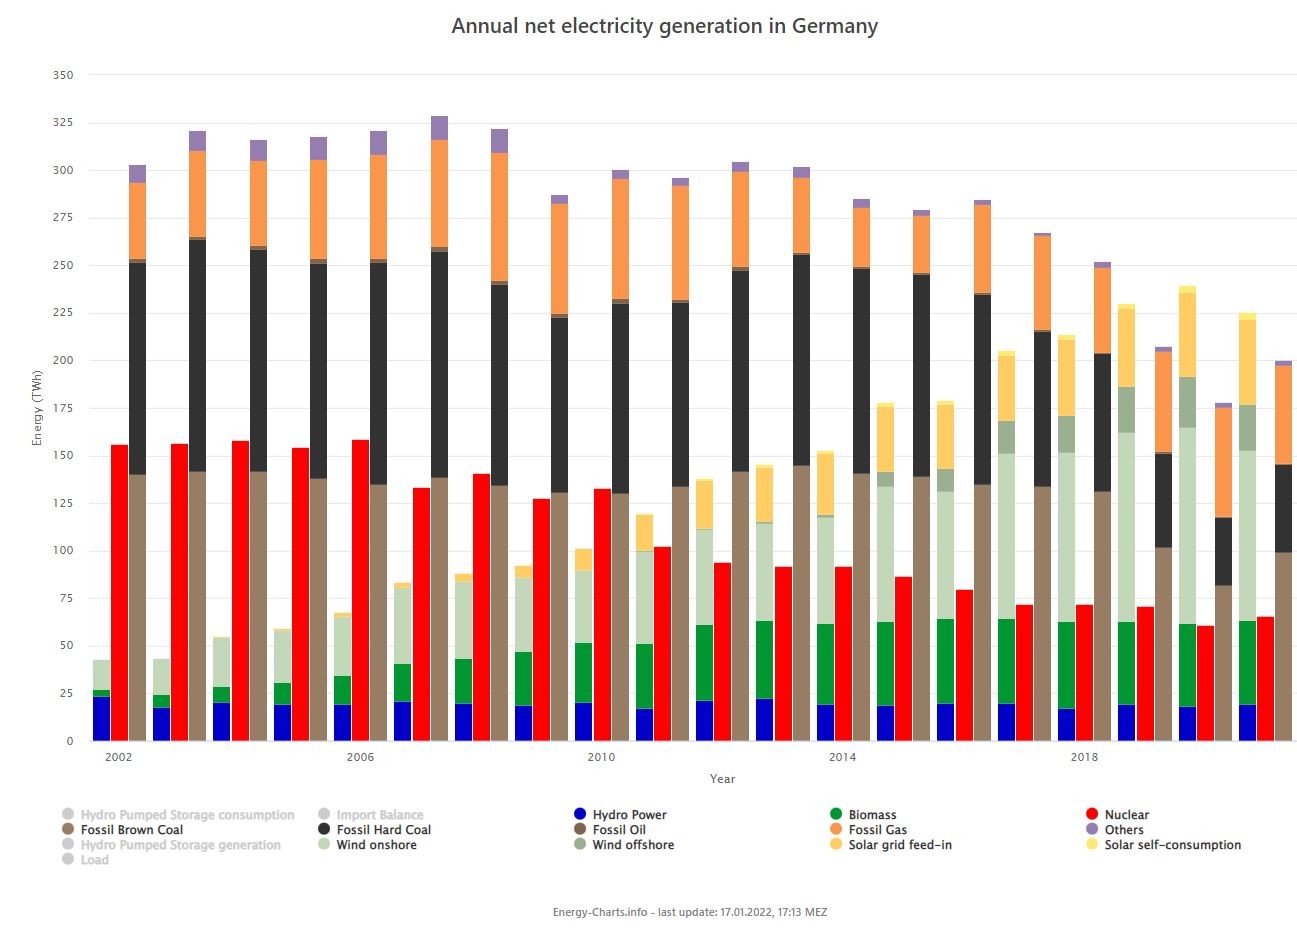
At 65.4 TWh, net electricity generation from nuclear power was around 7 percent above the level of the previous year (60.9 TWh). The lower generation in 2020 was due to longer outages at the Gundremmingen C power plant. In addition, due to the planned shutdown on December 31, 2021, the fuel assemblies at the Brokdorf and Gundremmingen C nuclear power plants were not replaced in 2021, thus giving them a longer operating life.
Lignite-fired power plants increased their net production to 99 TWh. This is about 17 TWh higher than 2020, which experienced a Corona-related slump, but 3 TWh less than in 2019.
Net production from hard coal-fired power plants was 46.4 TWh, an increase of 11 TWh compared to 2020. This increase was due to high gas prices at the end of 2021, leading to a fuel shift from gas to hard coal.
Net electricity production from gas-fired power plants was around 51 TWh in 2021, falling below the 2020 value of 57 TWh. In addition to power plants for the public power supply, there are also gas-fired power plants in the mining and manufacturing sectors for captive power supply. These produced approximately an additional 35 TWh for industrial captive use, which is not included in this publication.
Electricity exchange price tripled
In 2021, the load increased by 29 TWh to 504 TWh, which is 19 TWh above the pre-Corona year of 2019. This includes electricity consumption and grid losses but excludes pumped-storage power consumption and self-consumption by conventional power plants.
The average volume-weighted day-ahead price on the electricity exchange was €93.35 per MWh, or 9.335 cents per kWh. This is more than three times the 2020 price (€29.52 per MWh) and 2.5 times the 2019 price (€36.64 per MWh). In 2021, the trading volume was 196 TWh. The average volume-weighted intraday hourly price was 99.20 € per MWh, or 9.92 cents per kWh, up from €32.53 per MWh in 2020 and €38.49 per MWh in 2019. The trading volume was 46 TWh.
The export surplus (physical flows) was around 19 TWh in 2021, roughly on a par with the previous year. Most of the exports went to Switzerland (12.6 TWh), followed by Poland (8.4 TWh), Austria (7.5 TWh) and Luxembourg (3.1 TWh). Germany imported 5.6 TWh from France. The physical electricity flows do not provide information on whether the electricity was actually consumed in the country or whether it was forwarded to neighboring countries.
The picture is different for the planned electricity trade. Here, planned exports to Austria (18.5 TWh), France (6.5 TWh), Luxembourg (3.9 TWh), Switzerland (1.8 TWh) and the Netherlands (1.6 TWh) can be seen. The imports are from Denmark (9 TWh), Norway (3.2 TWh), Sweden (2 TWh) and Poland (1,8 TWh).
About the data
This first version of the annual evaluation from 3.1.2022 takes all of the electricity generation data – from the Leipzig power exchange EEX up to and including 31.12.2021 – into account. Using the available monthly data from the Federal Statistical Office (Destatis) on electricity generation up to and including September 2021 and the monthly data on imports and exports of electricity up to and including October 2021, the hourly energy values from the EEX were corrected. For the remaining months, the correction factors were estimated based on past annual data. The extrapolated values are subject to larger tolerances.
Data on the German net electricity generation for public power supply is used as a basis. The difference between gross electricity generation and a power plant's self-consumption is the net electricity generation fed into the grid. The entire electricity industry calculates with net figures, e.g., for electricity trading, grid calculation, grid utilization, power plant deployment planning, etc. Even on the German power exchange EEX, only net power generation is traded. The transmission system operators calculate with net flows and only net figures are measured for cross-border power flows. Net electricity generation represents the electricity mix that actually comes out of the socket and is consumed in the household or used to publicly charge electric vehicles.
Hourly updated data can be found in the Energy Charts:
https://energy-charts.info/?l=en&c=DE
![net_public_electricity_production.JPG [ JPG 0.08 MB ]](/content/dam/ise/en/images/News/net_public_electricity_production.JPG)
![annual_renewables_share.JPG [ JPG 0.08 MB ]](/content/dam/ise/en/images/News/annual_renewables_share.JPG)
![annual_net_production.JPG [ JPG 0.13 MB ]](/content/dam/ise/en/images/News/annual_net_production.JPG)
Last modified: