| Duration: | September 2015 - August 2019 |
| Project Focus: |
EoL – Development of an Industrial Recycling Process for PV Modules


The Electrical and Electronic Equipment Act (ElektroG) was finally discussed in the German Federal Council (Bundesrat) on July 10, 2015. With that, the specifications of the European WEEE Directive (Waste Electrical and Electronic Equipment) were respectively implemented. Solar modules are classified as electronics scrap and must be recycled. By recycling the aluminum frames (10-15 % of the weight) and of the cover glass (70-75% of the weight) the legally prescribe quota is reached, however, this is not a satisfactory solution with respect to sustainability and resource saving. The separated remaining portion of silicon, silver contacts, tin, and heavy metal containing solder (lead) is usually burned together with the plastic foil.
8.1 million tons of PV modules are currently installed in Europe (source: PV Cycle). The BIFA Environment Institute assumes approx. 10,000 tons of end-of-life (EoL) modules in 2017. In 2022-2023, 100,000 t/a are expected with the tendency further increasing. With respect to the carbon footprint, silicon purification with a CO2 equivalent of 30-35 kg per kg solar silicon is the largest contributor to CO2 emissions (Table 2).
At our branch office in Halle/Salle, the Fraunhofer Center for Silicon Photovoltaics CSP, different separation processes, cleaning processes, and melting and crystallization technologies are used and advanced to offer scalable, cost-effective recycling processes.
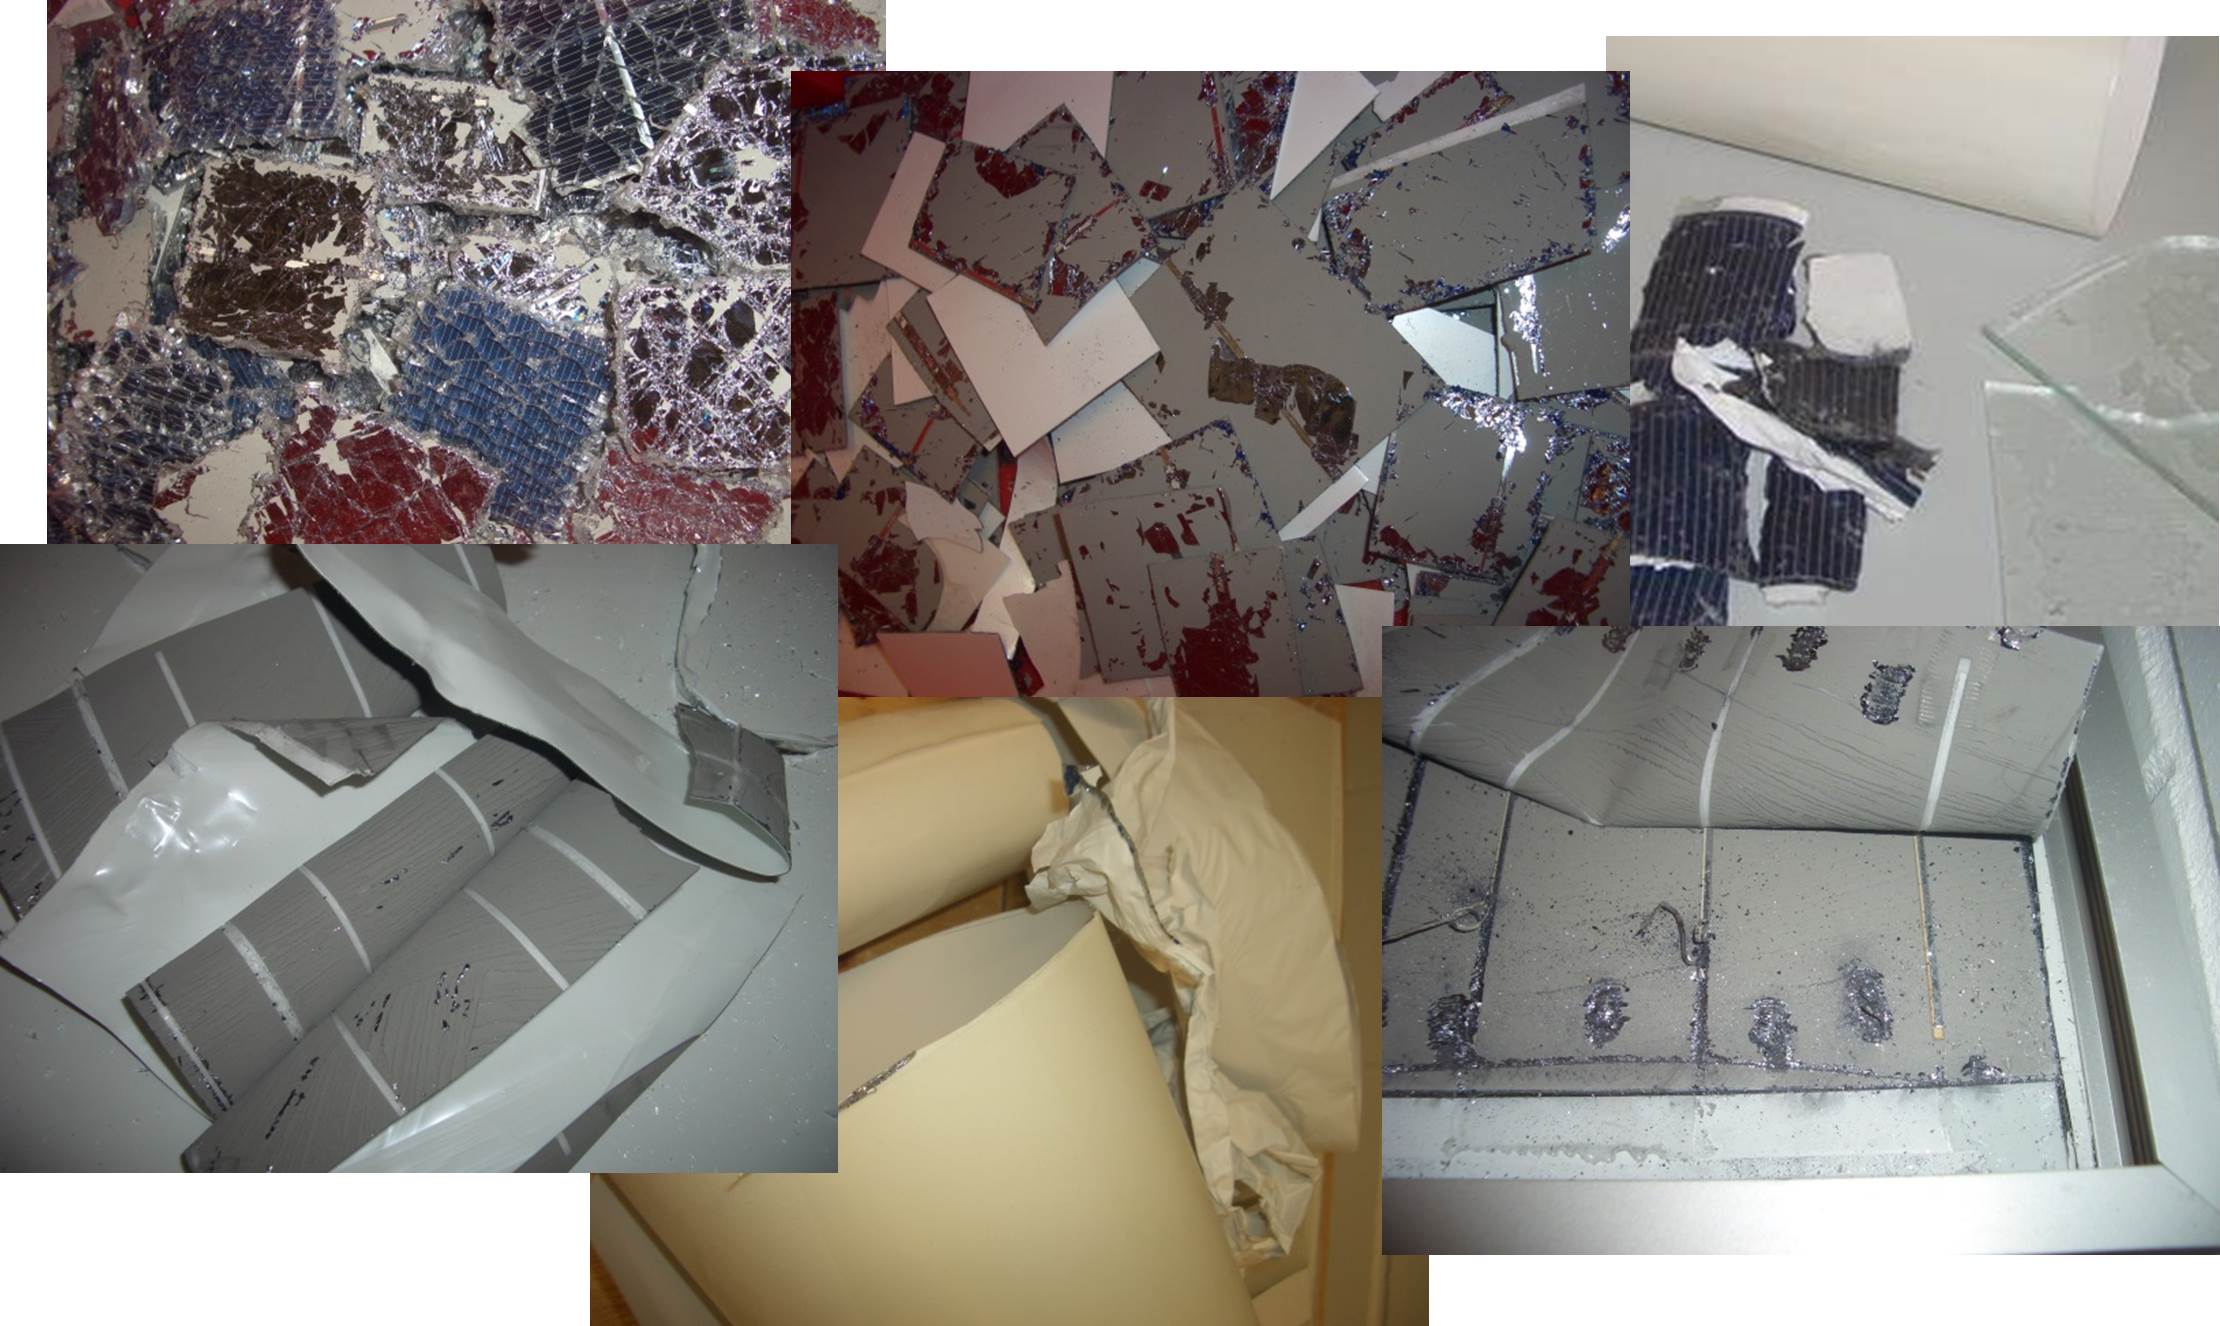
One of the greatest challenges is the variety of installed module types and module sizes. However, the recycling process should be universally usable. Fig. 1 summarizes which raw material portions are processed per ton of crystalline PV modules. The variation in the information is caused by the different module types and/or years of manufacture. In particular the silver consumption per cell was drastically reduced. A few years ago, it was still 30 g per module. Today it is at <10 g per 60-cell module. The used separation processes (we use thermal, mechanical, and chemical separation methods) must be very robust, as the laminated foil-cell compound shows very strong adhesion.
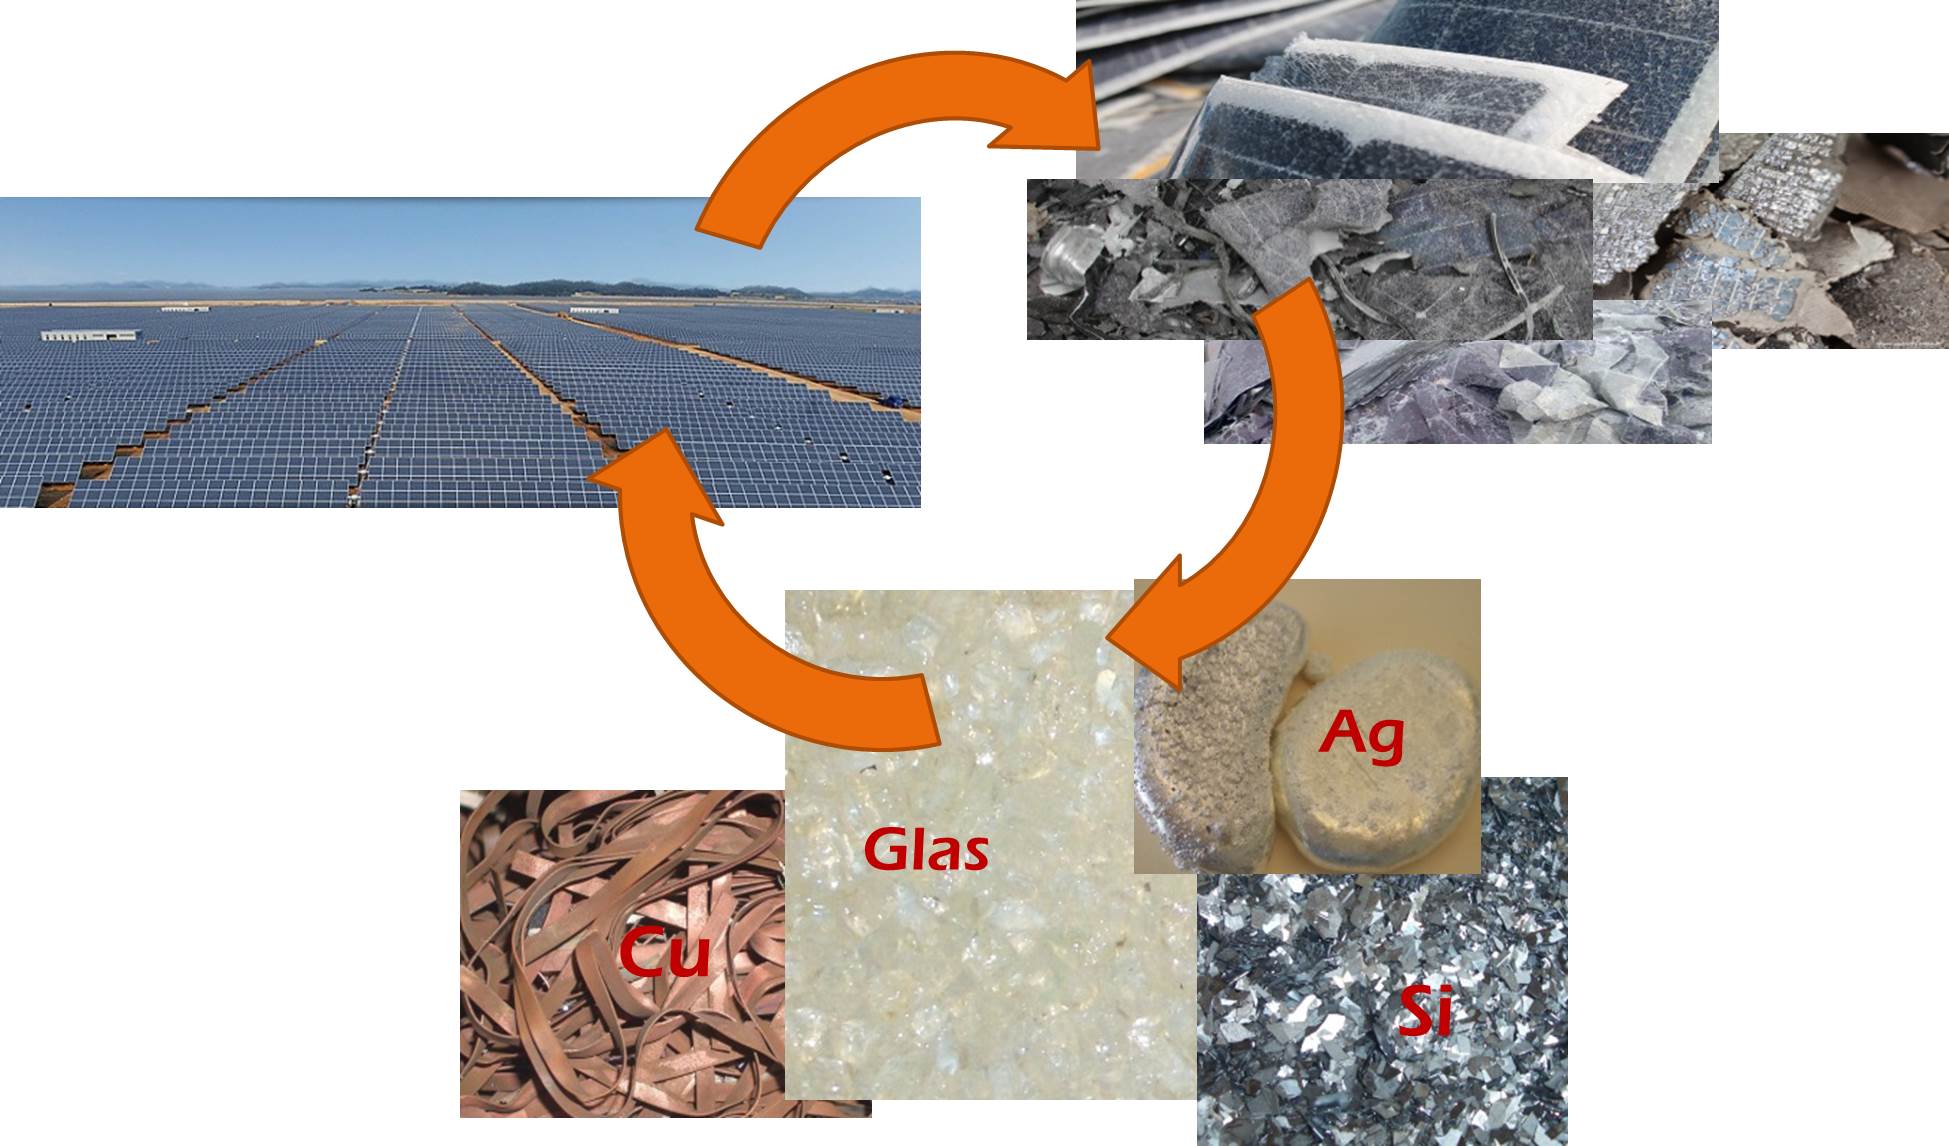
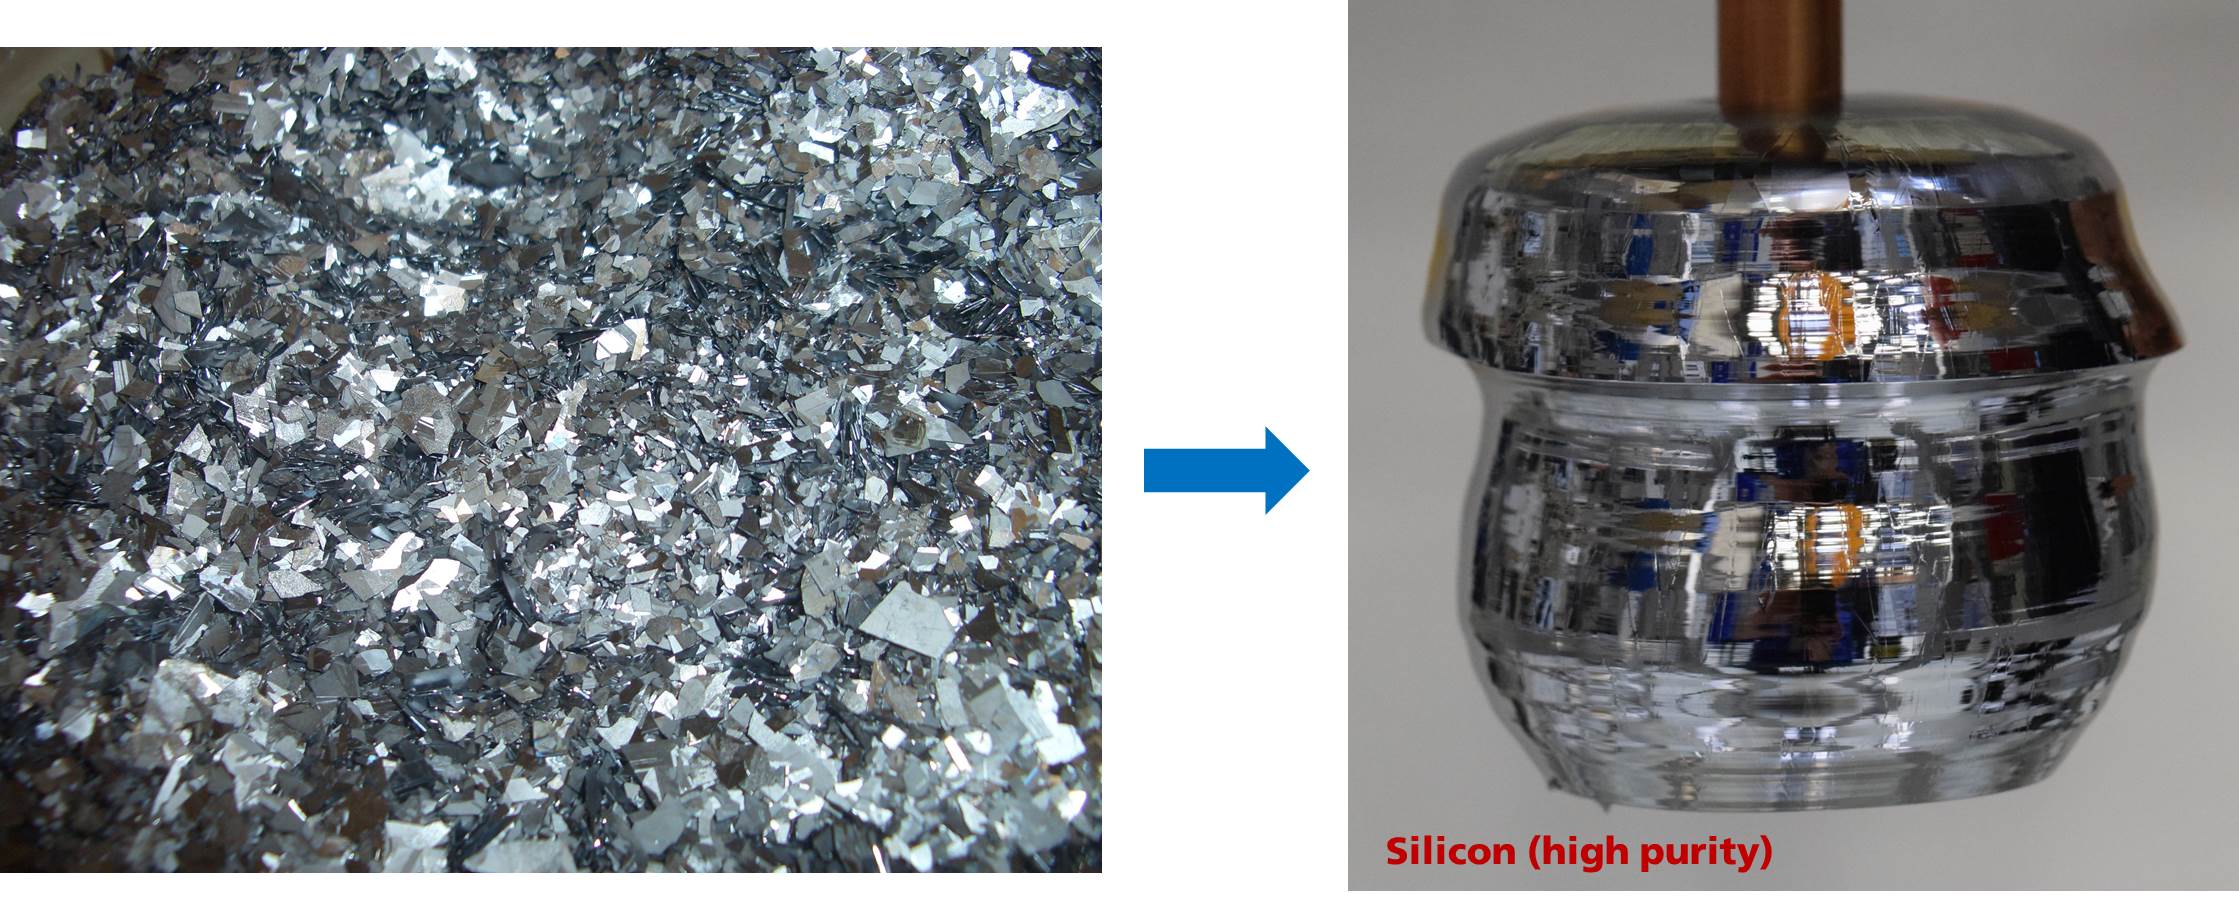
Our objective is the development of a recycling process suitable for industrial application. This includes homogeneous separation of the individual raw materials, which can then be returned into the materials cycle (Fig. 2). It is possible to disassemble and delaminate modules systematically. However, this is very time- and cost-intensive and thus hardly suited for an industrial process. Fraunhofer CSP has an excellent infrastructure available with respect to chemical, mechanical, and thermal process management. Furthermore, comprehensive system possibilities have been established for melting and crystallization of metals and silicon, as well as the required diagnostics for purity verification. A respectively prepared silicon block is shown in Figure 3: Boron-doped, highly pure silicon could be recovered from the cell scrap.
Table 1: Crystalline Si modules: Proportion of different material components per ton of waste modules. ©Fraunhofer ISE
| Average proportion per ton of module scrap |
||
| Silver | 0.5 - 1 kg | |
| Copper | 5 - 10 kg | |
| Tinn | 0.5 - 1 kg | |
| Silicon | 25 - 50 kg | |
| Alumunium (frame) |
100 - 150 kg | |
| Glass | 700 - 750 kg | |
| Plastic | Remainder |
Table 2: Carbon footprint of the used module materials during manufacturing from raw materials. ©Fraunhofer ISE Sources: 1) Internet: GI_02-11_10-12_Carbon_Footprint_of_Glass_Packaging (Beverage Industry 2/2011) 2) Foundry Review 56 (2009) 160-164 3) Estimate based on general plastic manufacturing 4) Estimate based on aluminum production 5) Calculated from the energy requirement for silicon cleaning according to the Siemens process (CVD process).
|