 Fraunhofer Institute for Solar Energy Systems ISE
Press Release #1
Net Electricity Generation in Germany in 2022: Significant Increase in Generation from Wind and PV
The Fraunhofer Institute for Solar Energy Systems ISE has presented its annual evaluation of electricity generation in Germany in 2022. The year was characterized by extreme prices and strong growth in renewable energies. Electricity trade with neighbouring countries also picked up. The share of renewables in net electricity generation, i.e. the electricity mix that actually comes out of the socket, was 49.6 percent and their share of the load was 50.3 percent. Only photovoltaics met the expansion targets set by the federal government, increasing its contribution to electricity generation by 19 percent. The analysis is based on the data platform energy-charts.info.
German photovoltaic systems generated about 58 TWh in 2022, of which about 53 TWh were fed into the public grid and 5 TWh were self-consumed. The addition of 6.1 gigawatts of photovoltaic power plants increased the installed capacity to about 66 gigawatts (as of November). This was the highest photovoltaic addition since 2013. Thanks to the addition and sunny weather, solar power generation increased by 19 percent compared to 2021. From April to August and in October, the monthly power generation of photovoltaic plants was higher than that of coal-fired power plants and from March to September higher than that of gas-fired power plants.
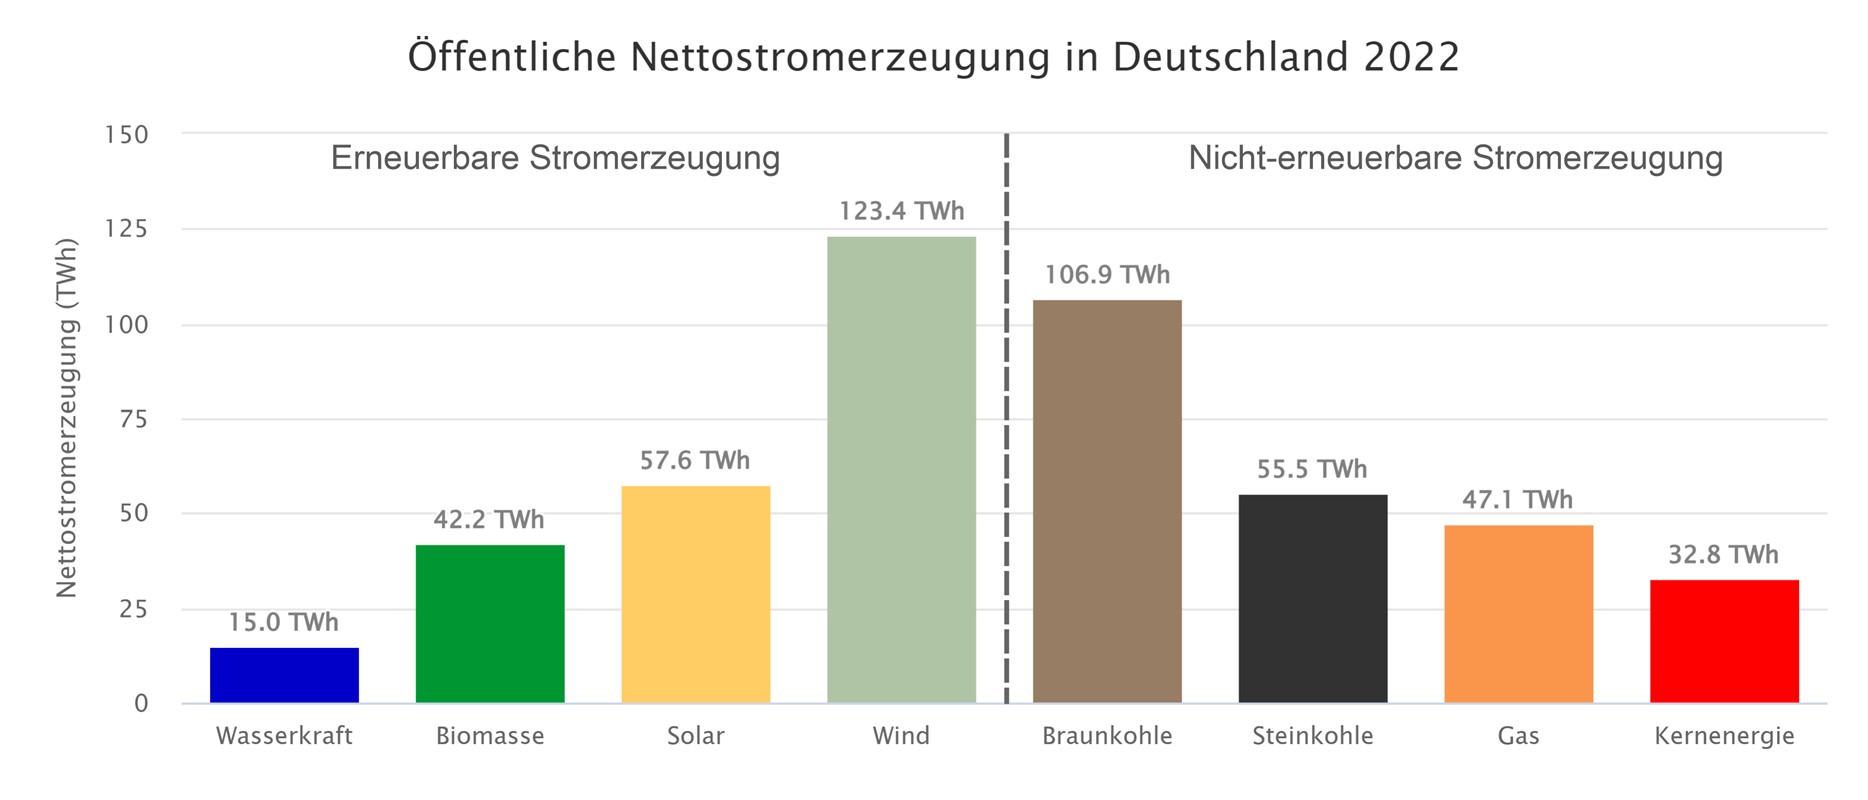
For wind onshore, 2022 was an average year; wind offshore was rather below average. Wind on- and offshore together produced about 123 TWh, down from 112 TWh in 2021. Wind generated the most electricity, followed by lignite, solar, hard coal, natural gas, biomass, nuclear, and hydro. Onshore wind power production accounted for about 99 TWh and offshore production for about 25 TWh, of which about 21 TWh was generated in the North Sea and 4 TWh in the Baltic Sea. The addition of wind both onshore and offshore was again very weak: at the end of November 2022, the installed capacity of onshore wind was 58 GW (up 2.1 GW from 2021) and of offshore wind was 8.1 GW (up 0.3 GW). Together, solar and wind produced about 181 TWh in 2022, about 21 TWh more than in 2021.
Hydropower generation of 16 TWh was significantly lower than 2021 (19 TWh) due to the hot and dry summer. Biomass, at 42.2 TWh, was slightly above the previous year's figure. There was little change in installed capacity. In total, renewable energy sources produced about 244 TWh in 2022, about 7.4 percent more than in the previous year (227 TWh). Their share of net public power generation increased to 49.6 percent (up from 45.6 percent in 2021), and their share of load was 50.3 percent.
In addition to net public power generation, total net power generation includes self-generation by industrial and commercial enterprises, mainly using gas. Renewables accounted for about 44.5 percent of total net electricity generation, including power plants of "manufacturing, mining, and quarrying establishments."
The load on the power grid was 484 TWh. This is about 20 TWh less than in 2021. Due to high electricity prices and higher temperatures, electricity was probably saved significantly. Load includes power consumption and grid losses, but not pumped-storage power consumption and self-consumption by conventional power plants.
Comeback of coal-fired power generation
Russia's attack on Ukraine in February 2022 led to severe distortions in the energy markets and a collapse in natural gas imports from Russia. In Europe, this situation combined with an outage of half of France's nuclear power plant fleet led to high electricity prices.
This shortfall was partly offset by an increase in coal-fired power generation, which now rose for the third year in succession after a downward trend since 2013. Lignite increased to 107 TWh (2021: 99 TWh), and hard coal to 56 TWh (2021: 47 TWh). By contrast, the use of natural gas to generate electricity fell from 52 TWh to 47 TWh.
Due to the shutdown of the three nuclear power plants Grohnde, Gundremmingen C and Brokdorf, generation from nuclear power dropped by 50 percent from 65 TWh to 33 TWh.
Export surplus and stock market electricity prices up sharply
In 2022, electricity trading (planned or scheduled) generated an export surplus of around 26 TWh. This is 9 TWh more than in 2021, with the majority of exports flowing to Austria (16.0 TWh) and France (15.3 TWh), followed by Switzerland (6.6 TWh) and Luxembourg (3.9 TWh). Germany imported electricity from Denmark (10.3 TWh), Norway (3.7 TWh ) and Sweden (3.1 TWh).
The average volume-weighted day-ahead exchange electricity price was €230.58/MWh or 23.058 cents/kWh. This is approximately 2.5 times the 2021 price (€93.35/MWh) and 6.3 times the 2019 price (€36.65/MWh).
Due to the Corona pandemic, 2020 should not be used for comparisons.
About the data basis:
This first version of the annual evaluation takes into account all electricity generation data from the Leipzig power exchange EEX and the European Network of Transmission System Operators for Electricity ENTSO-E up to and including December 31, 2022. Using the available monthly data from the Federal Statistical Office on electricity generation up to and including September 2022, the quarter-hourly values from the EEX were corrected for energy. For the remaining months, the correction factors were estimated on the basis of past monthly and annual data. The extrapolated values from October to December are subject to larger tolerances.
The data on net electricity generation for public electricity supply are used as a basis. Net electricity generation is the difference between gross electricity generation and the power plants' own consumption. It is fed into the public power grid. The entire electricity industry calculates with net figures, e.g. for electricity trading, network calculation, network utilization, power plant deployment planning etc. Only net power generation is traded on the power exchanges, transmission system operators calculate with net flows, and only net figures are measured for cross-border power flows. Net electricity generation represents the electricity mix that actually comes out of the socket at home and is consumed in the household or used to charge electric vehicles in public.
Hourly updated data can be found in the Energy Charts: https://www.energy-charts.info.
The platform not only provides data on German electricity generation, but also on 44 eu countries from Albania to Cyprus. In addition to charts on European power generation, there are also charts on exchange electricity prices, the levels of storage power plants, fossil fuel power plant emissions, and the locations of power plants and power lines.
![stromerzeugung_22_Quellen.jpg [ JPG 0.11 MB ]](/content/dam/ise/de/images/presseinfos/2023/stromerzeugung_22_Quellen.jpg)
![Anteile_Europa.jpg [ JPG 0.07 MB ]](/content/dam/ise/de/images/presseinfos/2023/Anteile_Europa.jpg)
Last modified: