For a Better Understanding of the Energy Transition: Fraunhofer ISE Interviews Users of the Energy Charts
The Energy Charts, compiled by the Fraunhofer Institute for Solar Energy Systems ISE, are the most detailed database for energy and market data on power generation in Germany and thus an important source for journalists and decision-makers. The interpretation of the data and graphics, however, is to some extent complex. A current project of Fraunhofer ISE is to improve the display of data and graphics in order to make them easier to use for journalists. Other users of the site will also profit from these improvements.

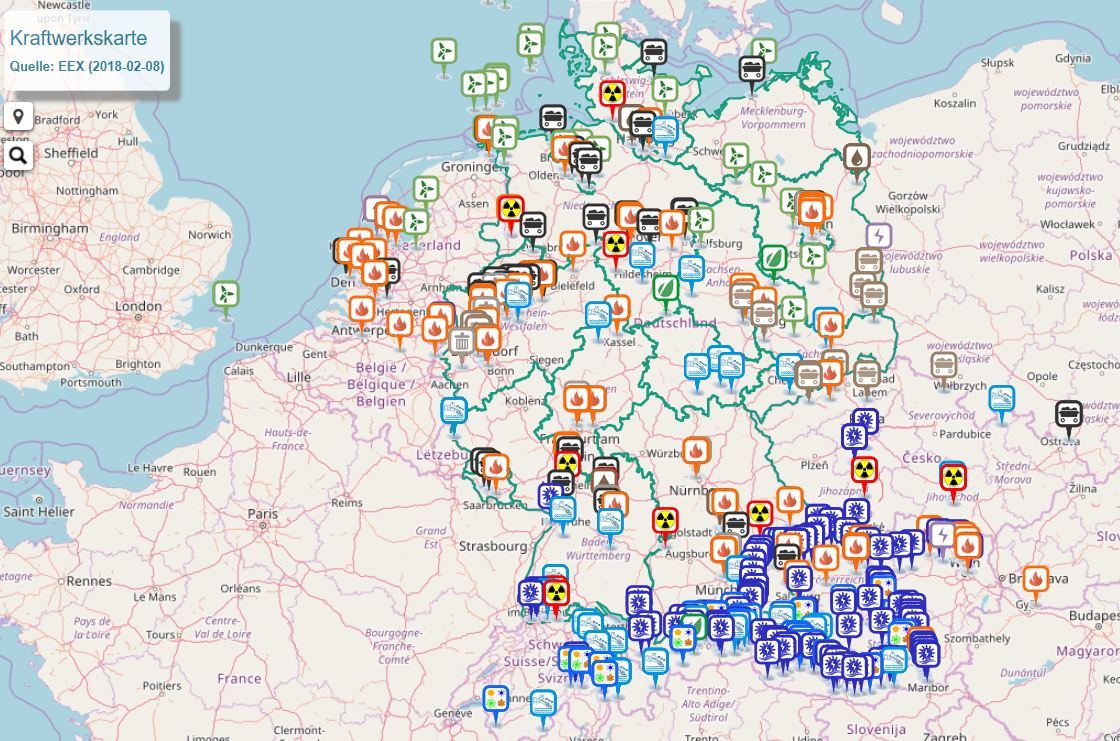
One feature of the Energy Charts: The interactive power plant map includes all power plants listed on the European Power Exchange. Operator, installed capacity, energy source, transmission system operator and year of commissioning are shown. You can also superimpose the high voltage power lines within Germany.
Users of the Energy Charts are invited to take part in a short survey which will be the basis for the improvements.
The survey takes about 5-10 minutes and is anonymous.
Last modified:
