Interactive Map of Germany with Power Plant Sites – New Feature of the Fraunhofer ISE Energy Charts
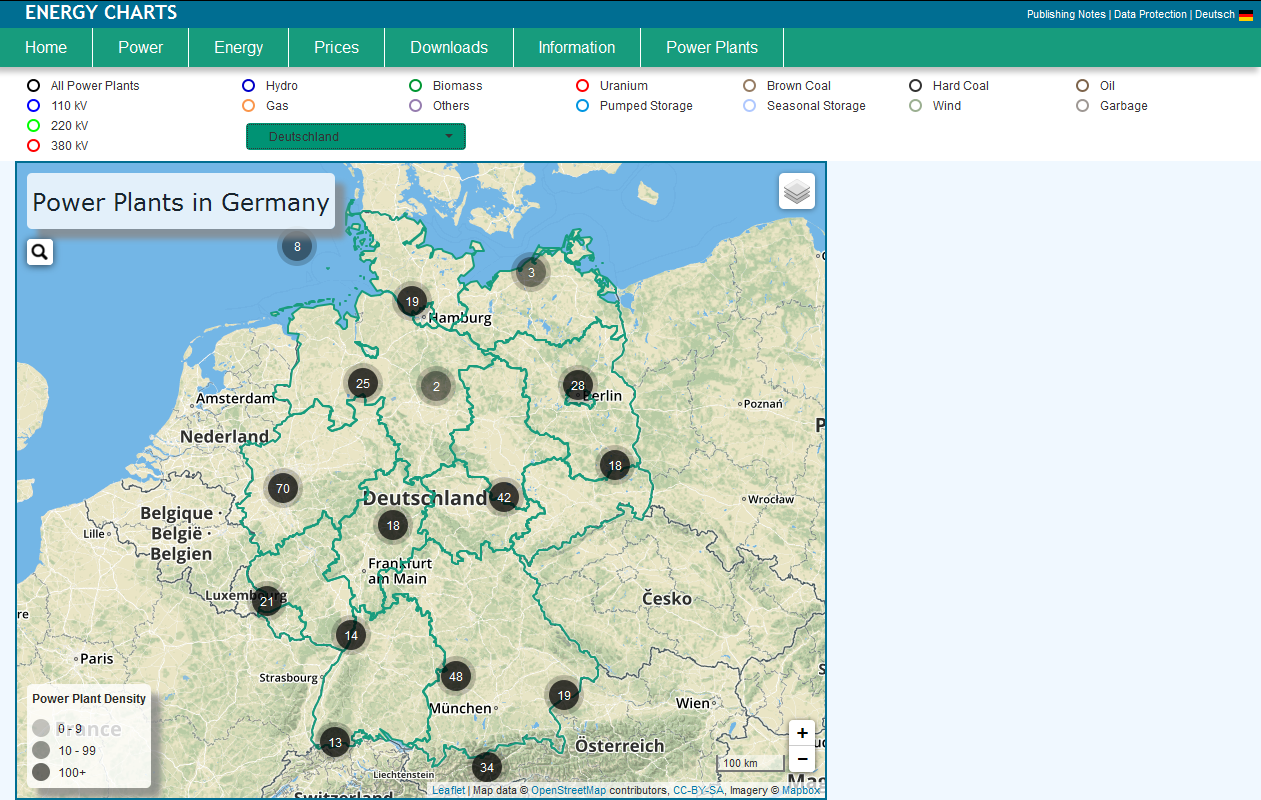
The Fraunhofer ISE Energy Charts presents up-to-date data on German electricity production using user-friendly graphs. Now an interactive map has been added that shows the locations of all power plants listed on the European Energy Exchange (EEX) in Leipzig. This new map provides a quick overview of the power plant locations and their grid connectivity.


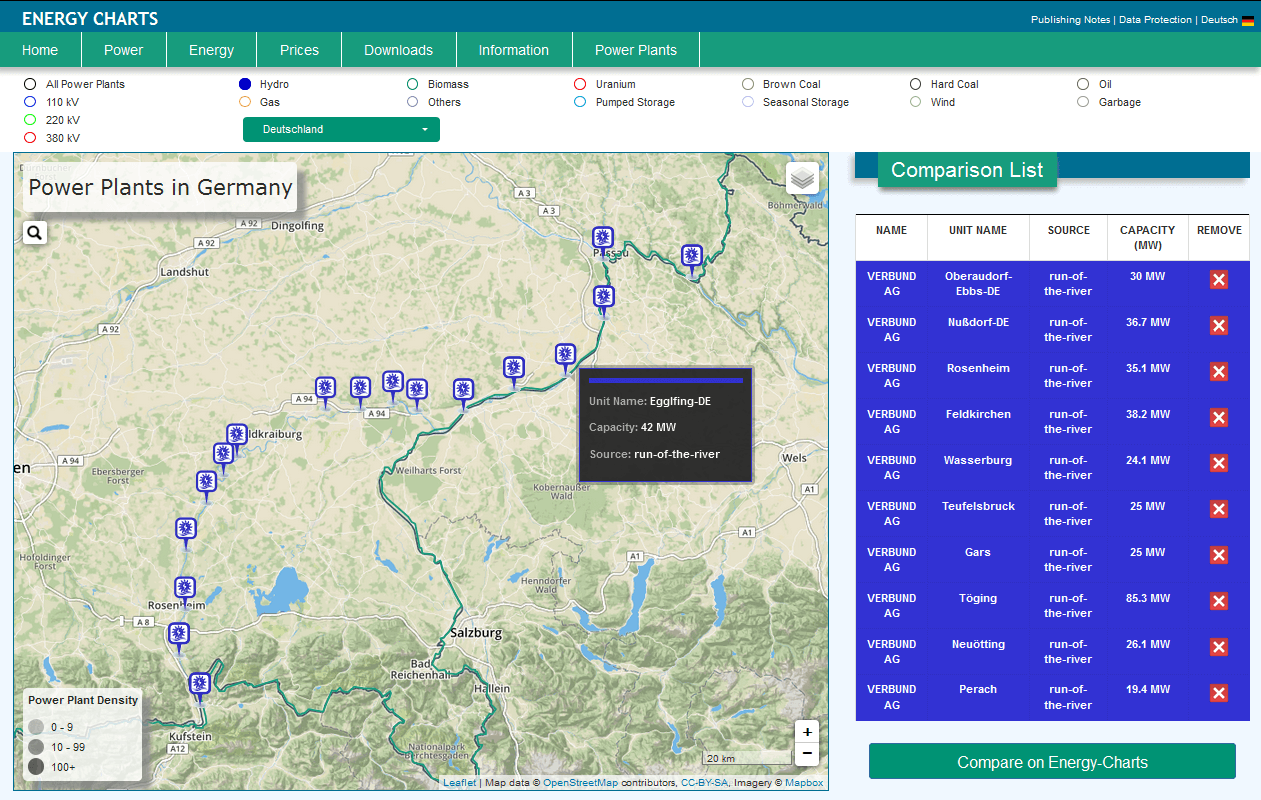
The interactive map has several search options and levels of detail for searching the different power plant locations, their data and connectivity to the electrical grid. Depending on the zoom level selected, one or many power plant locations are shown. If you drag the mouse along a power plant symbol, the name of the power plant is shown. By clicking the power plant, a pop-up window appears with relevant information about the power plant, for example: fuel type, nominal power and owner. With the function “compare”, specific data on the selected power plants are listed in a table for easy comparison. In the Energy Charts, the hourly electricity produced by a singular power plant or groups of power plants is shown when the plant is clicked.
There are several different options for displaying the power plants. One can either show the power plants as a group in each of the German states or select the plants according to their different types of fuel. The fuel selection includes: hydropower, biomass, nuclear, lignite, hard coal, oil, gas, pumped storage, seasonal storage and wind power. Data from photovoltaic (PV) power plants is not available, since the EEX lists only those plants that are larger than 100 MW. As of now, no solar PV plants that large exist in Germany.
Grid connectivity is another search category. In addition to the power plants, the electricity grid can also be superimposed on the map. Three different grid voltages, namely 110 kV, 220 kV and 380 kV, can be displayed, allowing a quick overview of how the different power plants are connected to the transmission grid.
The map of the power plants and transmission grids in Germany can be displayed in different levels of detail. The simplest version shows Germany in gray tones and little detail. A second, more detailed version shows all the streets, and the highest level of detail is shown in the OpenStreetMap view.
Cooperation with the University of Stuttgart
The map of the power plants was created in cooperation with the Visualization Research Center VISUS of the University of Stuttgart as part of a Master′s thesis. Prof. Daniel Weiskopf, thesis supervisor at VISUS, explains: “The time-dependent nature of the energy data presents interesting challenges for its visualization. Our goal was to present this data in an understandable way using interactive graphics.” Prof. Dr. Bruno Burger, initiator and author of the Fraunhofer ISE Energy Charts is also pleased about the good cooperation with VISUS and the resulting new feature integrated in the Energy Charts: “With the power plant map, it is now possible to rapidly gain an overview of the power plant capacity within a specified region, including the technical data and a visualization of the electricity production.”
Last modified: